
AI Ready Charts
Important
This tutorial assumes a moderate familiarity with AI models, such as OpenAI's GPT, Google's Gemini, and Anthropic's Claude. Understanding the limitations and variations of the language model you choose is crucial, as some models offer more accurate or relevant results than others.
To achieve the best outcomes, it's essential to experiment with different models, their configurations, and your prompting. For example, GPT-4o has significantly more inherent knowledge than GPT-4o-mini, which means that a prompt for GPT-4o-mini will require more domain-specific knowledge. We recommend starting with a more complex model during early development to gain a clear understanding of its capabilities, and then experimenting with smaller, faster models to find the optimal balance of speed and efficiency for your project.
The way you format your prompt is crucial, as it influences how the language model interprets the input and responds. It is recommended to consult the documentation of the AI model you are using to implement your AI Ready features.
A sample prompt is included at the bottom of this tutorial.
Introduction
ChartIQ v9.7.0 introduced the executor function, enabling developers to leverage AI capabilities to transform how users interact with and analyze their data. The executor function allows AI to drive the chart by passing command line interface commands from outside the CLI Plugin, giving AI the ability to change the chart type, adjust the periodicity or range, add a study, add a series, reset the chart, and more.
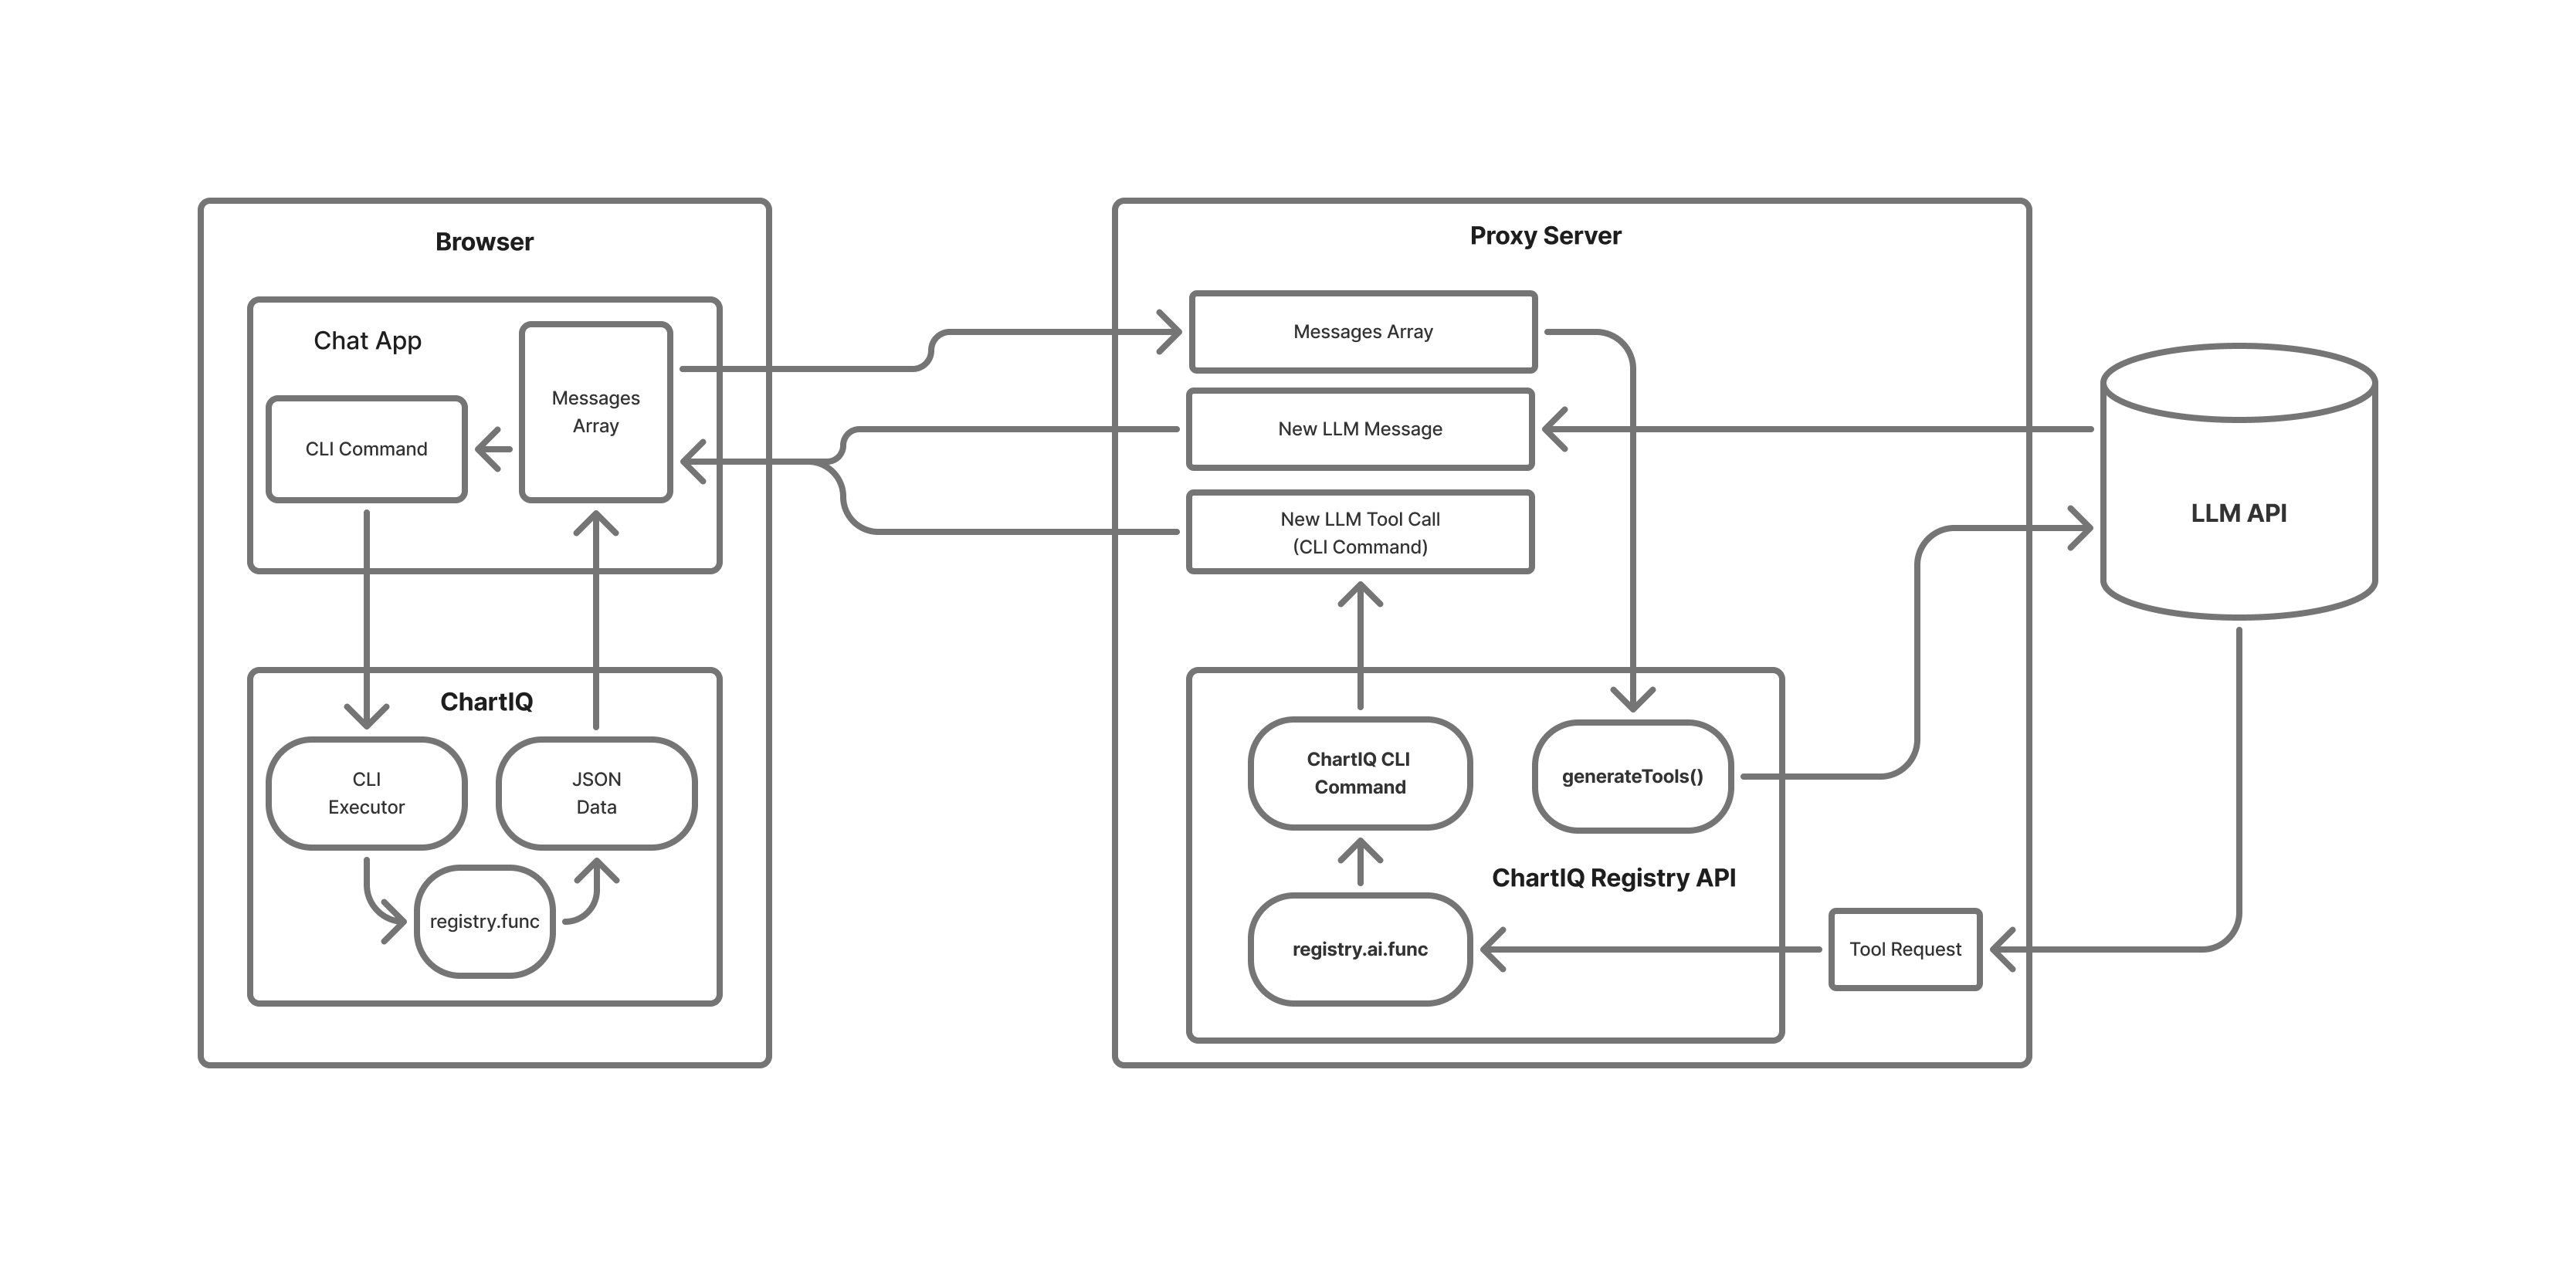 Figure. AI API Architecture Diagram
Before You Begin
| Library Version | CLI Plugin | AI Plugin | Notes |
|---|---|---|---|
| 10.1.0+ | Stable | Stable | CLI and AI no longer experimental. |
| 10.0.0 | Experimental | Experimental | AI plugin introduced as experimental. |
| 9.7.0 | Experimental | Experimental | CLI executor() function and AI tutorial introduced. |
| 9.6.0 | Experimental | Not available | CLI plugin and tutorial introduced as experimental. |
| < 9.6.0 | Not available | Not available | CLI/AI features not supported. |
Note:
- This tutorial requires ChartIQ library version 9.7.0 or later.
- The AI Ready plugin depends on the CLI plugin.
- To get a copy of the library and the plugin, contact your Account Manager.
Getting Started
This tutorial will guide you through the basic steps of setting up your executor function to accept input from a custom UI, such as an AI-powered chat agent.
For this tutorial, we'll be working with sample-template-basic.html.
Note: sample-template-basic.html is located within examples/templates and must be copied to the root directory for the import references to work.
Create A Reference
Ensure that the CLI plugin has been imported.
Then, create a reference to it.
import "./plugins/cli/cli.js";

const aiReady = document.querySelector("cq-cli");
Create Your Environment
This step is necessary if you are implementing a custom UI that will capture your natural language input, display any output, or both.
If you do not provide an environment, your executor can still function, but there will be no UI to display the responses returned. In other words, if your AI response is configured correctly, the chart will still be manipulated, but the responses will not be visible.
Modify existing HTML
- Add a style attribute to
cq-contextand set its width to 75%. - Create the side panel and include a basic input field and submit button.
- This is an example of where the end user might enter their natural language input for processing by the AI model.
<body>

<cq-context style="width: 75%;"><cq-chart-instructions></cq-chart-instructions>

<!-- Template Specific HTML -->

</cq-context>
<div id="sidePanel" style="width: 25%; position: fixed; right: 0;">
  <form id="aiInputForm">
    <input id="aiInputField" type="text" placeholder="Enter your command">
    <button type="submit">Submit</button>
  </form>
</div>
Override CLI methods
To interact with our newly created UI, we need to override the echo method from the aiReady reference. This is necessary because the executor function is bound to the CLI plugin and utilizes its echo and log methods by default. By overriding the echo method, we can control how we display any command output.
-
Create a function to process text returned after running a command: In this example, we define the
sidePanelEchofunction, which creates adiv, sets itsinnerTextto the command's output, and appends it to the side panel. Note: Not all commands return text. -
Create a
sidePanelEnv: This is an object that will hold the overridden methods and will be added to ouraiReadyreference when creating theexecutorin the next step. -
Override the
aiReadyecho method: Now, we assign our newly createdsidePanelEchomethod to theechoproperty of thesidePanelEnvobject, effectively replacing the originalechomethod with our custom implementation.
function sidePanelEcho(text) {
  const node = document.createElement("div");
  node.innerText = text;
  document.getElementById("sidePanel").appendChild(node);
}

const sidePanelEnv = {}; // Define an object to hold overridden methods that will be added as prototypes to the CLI reference

// Override the `echo` method of CLI
sidePanelEnv.echo = sidePanelEcho;
Creating your executor
Finally, we will create our executor by calling the aiReady reference's getExecutor method. This method takes the 'environment' we created and modified in the previous step, along with the registry object, as arguments. You only need to include the registry object in getExecutor if you are adding custom commands to the registry from within your template.
Note: A passed registry will replace the built-in registry, so it's best to extend or modify the existing registry when adding custom commands.
Example:
import { registry } from "./plugins/cli/registry.js";
// ...
// ...
const updatedRegistry = { ...registry };

updatedRegistry.myCustomCommand = {
  func: function () {
    // ...
    // ...
  }
}
const executor = aiReady.getExecutor(sidePanelEnv, updatedRegistry); // Create executor with your modified registry object
As mentioned previously, if you are not utilizing a custom UI and methods, you do not need to provide the environment we created in the previous step and can simply call getExecutor() without any arguments.
const executor = aiReady.getExecutor(sidePanelEnv); // Create executor
Using the executor
With the executor defined, we can now pass commands using the executor method. Please refer to the CLI Tutorial for available commands and proper syntax.
This example utilizes the simple input we created in the earlier step to pass the value of the input to the executor.
// Add a submit event listener to the off-chart form
document.getElementById("aiInputForm").addEventListener("submit", (event) => {
  // Prevent the default form submission behavior
  event.preventDefault();

  // Get the input value and pass it to the executor function
  const inputValue = document.getElementById("aiInputField").value;
  executor(inputValue);

  // Reset the form after submission
  document.getElementById("aiInputForm").reset();
});
Using the executor with AI
Important: There are several nuanced steps involved in passing input to your AI and processing its response, which is why they are not included in this tutorial. Instead, use it as a starting point to configure your executor and prepare it to accept AI responses.
The UI we just built accepts valid CLI commands, such as type Line, prompting the chart to respond as if the command were entered directly into the CLI plugin's UI.
With AI, we can expand on this by executing commands generated from natural language input.
For example, a very simple prompt might look like this:
To display a specific chart type, write the following:
"type <chartType>"

Replace <chartType> with one of the following: Candle, Line, Mountain, Step, Columns.
A user can type the message "Show me a columns chart," and the model will respond with the command type Histogram, which you then pass into the executor.
We recommend limiting your model to JSON output for reliable responses.
The ChartIQ AI Plugin
About This Plugin
This tutorial provides guidance for building the AI integration from scratch using the ChartIQ Registry API. If you prefer a ready-made solution, ChartIQ also offers the Chart Explainer and Conversations plugin, which provides a complete, plug-and-play implementation. See the Chart Explainer and Conversations Tutorial for details.
For version requirements and plugin availability, refer to the versioning table at the beginning of this tutorial.
AI Plugin Introduction
LLMs interface with ChartIQ via the the chart Command Line Interface. The AI plugin provides some useful tools to help you prompt your LLM with ChartIQ CLI commands. In the plugin folder is a JavaScript module chartiq-registry-api.js that you can include in your AI app. This module contains several helper functions that read the CLI registry of commands and outputs them in AI appropriate formats.
In the chartiq/plugins/ai folder, there is a JavaScript module chartiq-registry-api.js that you can include in your AI app. This module contains several helper functions that read the CLI registry of commands and outputs them in AI-appropriate formats.
There are two preferred methods for generating CLI commands for the chart: JSON output or tools. Each method has its own advantages, so choose the one that best suits your AI application. Both methods instruct the LLM to produce a CLI command string, which you will then pass into the CLI executor function.
JSON Output
Prompting the LLM to generate CLI commands is the most straightforward way to control the chart. This is done by including a list of CLI commands in your prompt (usually the system prompt) and instructing the model to generate a json object of the CLI commands that can be processed in your app.
Prompting the LLM
When generating a JSON output, it's necessary to inform the model of available CLI commands. The ChartIQ Registry API provides a helper function to write a list for you.
The writePrompt function reads the CLI registry and automatically generates formatted instructions suitable for language models. This function extracts all commands that have AI configuration and formats them with proper syntax notation, parameter descriptions, and constraints.
Here's how to implement it in your application:
import { registry } from "chartiq/plugins/cli/registry.js";
import { ChartIQRegistryAPI } from "chartiq/plugins/ai/chartiq-registry-api.js";

// Generate the command list for your AI prompt
const commandList = ChartIQRegistryAPI.writePrompt(registry);

// Build your complete prompt
const systemPrompt = `You are in control of a charting program called "ChartIQ". ChartIQ is a time-series chart used to visualize financial data.
A ChartIQ chart will have two axis. The X axis will indicate a span of time. The Y axis will indicate a data value, usually a price.

You will receive a request from the user.
You will receive a list of text commands that control the chart.

You will read the user's request and determine which of the text commands best matches the user's request.

Your response will be in the form of a json object with the following structure:
{
    "message": "A message to the user"
    "cmd": [],
}

The "message" field will contain the message to be displayed to the user.
- If the user asks a question, do your best to answer the question in the message only if the question is related to the chart.
- If the message is ambiguous, respond with a helpful suggestion of how to clarify the request.
- if you do not have an answer, you can respond with "I don't have an answer to that question".
- The message should provide a narration explaining each command.
- The message should be as short as possible.
The "cmd" field will contain an array of commands that best fit the user's request.
If no command fits the user's request. You will respond with the command "unknown".

Available ChartIQ commands:
${commandList}`;
The commandList variable is inserted at the end of the prompt, adding the available commands to the prompt.
Alternative JSON Output: The writePrompt function also supports JSON output format by passing { outputFormat: "json" } as the second parameter. This generates a structured JSON string containing the same command information. The JSON format is provided for developer preference and contains the same information as the default list.
Example AI Response
Using the above prompt with the following request, "Change the chart type to a line chart," the expected AI response would be something like:
{
  "message": "I will change the chart type to a Line chart.",
  "cmd": [
    "type Line"
  ]
}
The values in the cmd array would then be passed into the executor: executor("type Line"), while the message string can be used to provide feedback to the user.
AI Tools / Functions
If your environment supports it, tools / functions are a preferred method of generating CLI commands. Using tools to generate the CLI commands reduces the chance of errors that can come from the model generating malformed JSON or hallucinating a chart command that doesn't exist.
Many AI platforms (OpenAI, Anthropic Claude, Google Gemini) support function/tool calling, where the AI can call predefined functions with structured parameters. The ChartIQ Registry API provides the generateTools function to automatically convert CLI registry commands into a data object that is used to create executable tool definitions for AI systems. When an AI system calls these tools, the functions execute and return CLI command strings that can be passed to the executor.
Key Benefits of Tools/Functions:
- Structured Parameters: AI systems receive precise parameter schemas with validation
- Reduced Errors: Function calling prevents malformed command syntax
- Enhanced Descriptions: Parameter descriptions include enum values, format patterns, and examples
- Automatic Validation: AI platforms validate parameters before function execution
- Reliable Execution: Functions always return properly formatted CLI commands
The Tool Data Object
The data object returned from the generateTools function contains descriptions, parameter definitions with enhanced descriptions (including enum values, format patterns, and examples), and executable functions.
Example of the generated tools structure:
{
  "type": {
    "description": "Changes the chart display type",
    "parameters": [
      {
        "name": "chartType",
        "type": "string",
        "description": "The type of chart to display. Must be one of: \"Candle\", \"Line\", \"Mountain\"",
        "required": true
      }
    ],
    "func": function(chartType) { return "type " + chartType; }
  }
}
Using the tool data object
The following example sets up a request payload containing tools. This example is designed for the OpenAI API. However it can easily be adapted to other providers:
import { registry } from "chartiq/plugins/cli/registry.js";
import { ChartIQRegistryAPI } from "chartiq/plugins/ai/chartiq-registry-api.js";

// Generate tools from the CLI registry
const tools = ChartIQRegistryAPI.generateTools(registry);

// Convert tools to AI platform format (example for OpenAI)
const aiTools = [];
for (const [toolName, toolConfig] of Object.entries(tools)) {
  const properties = {};
  const required = [];

  // Build parameter schema
  for (const param of toolConfig.parameters) {
    properties[param.name] = {
      type: param.type,
      description: param.description
    };

    if (param.required) {
      required.push(param.name);
    }
  }

  // Create OpenAI-compatible tool definition
  aiTools.push({
    type: "function",
    function: {
      name: toolName,
      description: toolConfig.description,
      parameters: {
        type: "object",
        properties: properties,
        required: required
      }
    }
  });
}

const payload = {
		model: "gpt-4o-mini",
		messages: payloadMessages,
		tools: aiTools,
};
Handling tool calls
The model will return a request to invoke a tool call. You will capture that request and execute the associated tool function. This will give you a complete ChartIQ CLI command that you can pass into the executor.
function handleToolCall(toolCall) {
  const tool = tools[toolCall.function.name];
  if (tool) {
    const params = JSON.parse(toolCall.function.arguments);
    const cmd = tool.func(...Object.values(params));

    return {
      toolCallId: toolCall.id,
      command: cmd,
      success: true
    };
  }
}
Inserting the chart feedback into the conversation
The executor response object can be inserted into the AI messages array and sent back to the LLM for either a summary or follow-up request.
  let result = await this.executor(command);

  payload.messages.push({
    role: "tool",
    tool_call_id: command.toolId,
    name: "chart",
    content: JSON.stringify(result)
  });
Example Implementation: See chartiq/plugins/ai/proxyserver/server.js for a complete working example of tools integration with OpenAI's API, including tool definition generation, execution handling, and response processing.
The Sample Chat App
The AI plugin includes a complete working example implementation that demonstrates how to integrate ChartIQ with AI-powered conversational interfaces. The sample chat app provides a practical reference for developers who want to create an AI assistant that can manipulate charts through natural language commands.
Important Note: This sample is specifically built for the OpenAI API and requires a valid OpenAI API key to function. However, the architecture is designed to be flexible and can be easily modified to work with other AI platforms such as Google's Gemini, Anthropic's Claude, or other compatible services by adjusting the API endpoints and request formats in the proxy server.
What the Chat App Does:
The sample chat application creates a side-by-side interface where users can interact with both a fully functional ChartIQ chart and an AI-powered chat interface. Users can type natural language requests like "change the chart to a line chart" or "add a moving average study," and the AI will interpret these requests, generate the appropriate ChartIQ CLI commands, and execute them on the chart. The chat interface displays both the user's messages and the AI's responses, along with the CLI commands being executed.
Key Components:
- Chat Interface: A conversational UI built with the
ChatAppclass that manages message flow, user input, and AI responses - AI Integration: Connects to AI services (like OpenAI's GPT) through a secure proxy server
- Command Execution: Uses ChartIQ's CLI executor to run AI-generated commands on the chart
- Tool Queue System: Manages sequential execution of multiple chart commands from a single AI response
Setup Instructions
Follow these steps to get the sample chat app running on your local development environment:
1. Prepare the Template File
Copy sample-template-chat.html from plugins/ai/ to the root directory of your ChartIQ package (the same level as other sample templates).
2. Set Up Your Development Server
Start a local development server to host the HTML file. You can use any development server such as:
- VS Code Live Server extension
- Node.js:
npx http-server
3. Configure the Proxy Server
Navigate to the plugins/ai/proxyserver directory and install dependencies:
cd plugins/ai/proxyserver
npm install
4. Configure Your API Key
The proxy server is designed to communicate with the OpenAI API and requires a valid OpenAI API key to function. You must obtain an API key from OpenAI at: https://platform.openai.com/api-keys
You have two options for configuring your API key:
Option A: Configure in config.js (recommended for development).
- Open
plugins/ai/proxyserver/config.js - Obtain an API key from your AI provider (e.g., OpenAI)
- Add your API key to the
apiKeyfield in the configuration
Option B: Enter at runtime.
- Leave the
apiKeyfield empty inconfig.js. The server will prompt you to enter the API key when it starts up.
5. Start the Proxy Server
From the plugins/ai/proxyserver directory, run:
node server.js
The proxy server will start on http://localhost:3000 by default.
6. Open the Chat App
Navigate to your development server URL and open sample-template-chat.html. The chat interface should appear alongside the chart.
Understanding the Proxy Server
The proxy server (plugins/ai/proxyserver/server.js) serves as a crucial intermediary between your chat application and AI services. It provides several important functions:
Security and API Key Management: The primary purpose of the proxy server is to secure your AI API credentials. Rather than exposing your API key in client-side JavaScript (where it could be viewed by users), the proxy server handles all AI API communications server-side. This prevents unauthorized access to your API keys and protects against potential misuse that could result in unexpected costs.
Two Operating Modes: The proxy server supports two different modes for AI interaction:
-
Tools Mode (default): Uses AI function/tool calling capabilities to generate structured ChartIQ commands. This mode leverages the
ChartIQRegistryAPI.generateTools()function to create OpenAI-compatible tool definitions from the CLI registry. When the AI wants to execute a chart command, it calls the appropriate tool function, which returns the exact CLI command string. -
JSON Mode: Instructs the AI to respond with structured JSON containing both a user message and an array of CLI commands. This mode uses
ChartIQRegistryAPI.writePrompt()to include command documentation in the system prompt, allowing the AI to generate commands based on textual descriptions.
Request Processing Pipeline: The server processes each request through several stages:
- Validation: Ensures the incoming request contains valid message data
- Message Construction: Builds the complete payload including system prompts, conversation history, and mode-specific configurations
- AI API Communication: Sends the request to the configured AI service with proper authentication
- Response Processing: Parses the AI response and extracts commands for execution
- Tool Execution: For tools mode, executes any tool calls and formats the results
Starting the Server:
node server.js          # Runs in tools mode (default)
node server.js tools    # Runs in tools mode (explicit)
node server.js json     # Runs in JSON mode
The proxy server facilitates communication between your chat application and AI services, ensuring a platform agnostic method in how commands are generated and executed.
Prompting
Here are a few key points to consider when creating your own prompt:
-
Provide Context: Our prompt begins by explaining what ChartIQ is and its visual layout, establishing a clear understanding of the user and defining the role for the AI model.
-
Be Specific: The prompt provides a list of commands to the AI model, ensuring it knows the appropriate syntax to respond with. This is critical because, without the correct syntax, the
executorcannot process the response. The prompt also instructs the model on how to reply to user requests. -
Structure the Response: If generating JSON, specify that the response should be in JSON format, detailing the structure. This allows for easy integration with the
executorfunction. -
Prompts in this tutorial are only an example: Your prompt should be specific to your charting application, its features, and the terminology your users will use.
Next Steps
To learn more about the CLI plugin, as well as how to customize or create your own commands, check out the CLI Tutorial.